UCSC Boardwalk File Browser
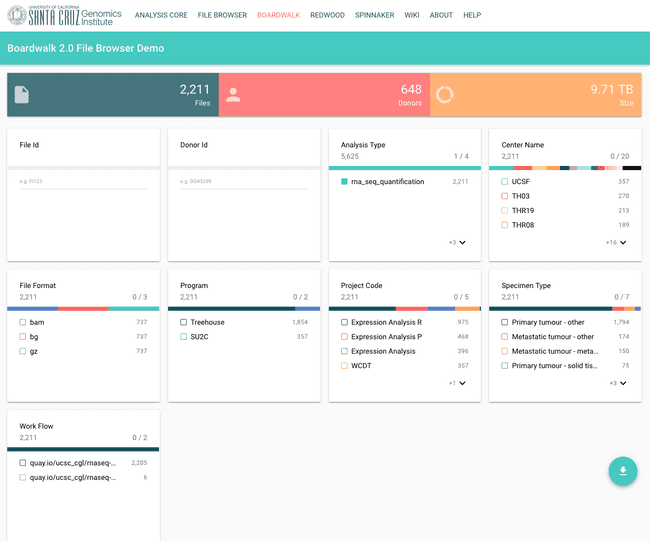
 The Original UCSC Boardwalk Faceted Browser Interface (Circa 2016)
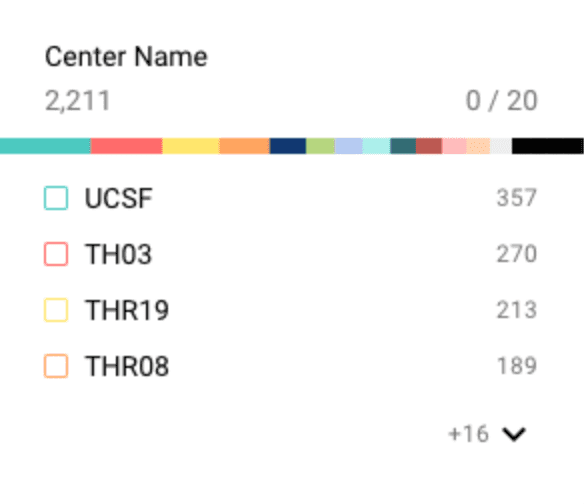
The Original Boardwalk Browser Facet Selectors
Together with team members from the UCSC Genomics Institute, we designed and developed the front end of the UCSC Boardwalk faceted file browser. This is an Angular web application with a back end (written by the UCSC team) in Elasticsearch.
The original Boardwalk user interface was selected as the starting point for the CZI Human Cell Atlas Data Browser and we wanted to share core aspects of the original design.
Design Goals
An original UI/UX design goal was to reduce/eliminate the need to scroll through a large table of files matching the search query to understand the ...
Integrated Data Summary
The version of the Boardwalk interface above, shows a summary of the data integrated into the facet selectors. The variation in the selected data for each facet, is shown in the horizontal stacked bar chart above each facet selectors. This graph shows the number and proportion of different facet values in the current result set.

For example, in the image above the facet you can see the number of “center names” and their relative proportions in the data. Selecting the “+16” would open up to display the full set of terms for this facet.

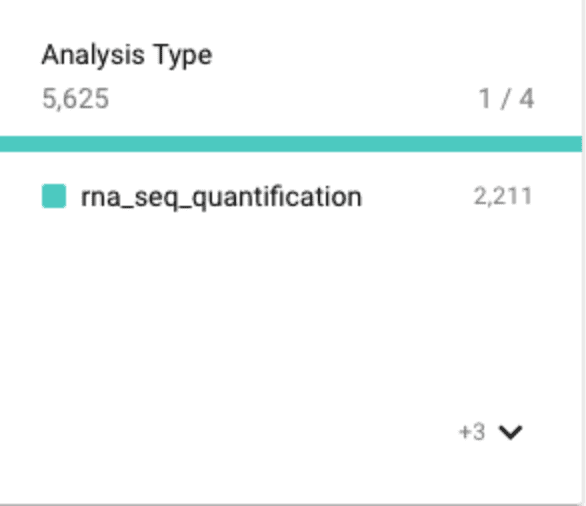
Likewise the Analysis Type facet shows, at a glance, that since ma_seq_quantification is selected it is the only value of this type in the result set. There is also an indication that there are 3 other values for this field that could be added into the result set.
Not super earth shattering but we wanted to show this integrated summary and explain its....
